
Weather forecasters rely on computer data, satellite images and their own observations to accurately forecast the weather. They’ve also got their own language for explaining it. Read on to learn how to understand a weather forecast.
Facts about Understanding the Weather Forecast
- A high pressure system occurs when dry, cool air spirals in a clockwise direction, bringing mild weather and sunny, blue skies.
- A low pressure system is moist, warm air swirling in a counter-clockwise direction. Low pressure systems usually mean stormy, wet weather.
- Relative humidity refers to how much moisture is in the air compared with how much moisture the air can hold. The more humid it is, the warmer you feel in hot weather and the colder you feel in winter weather.

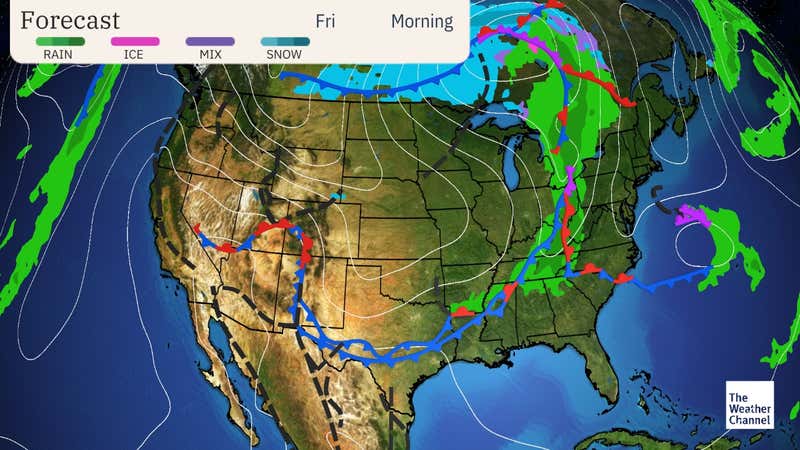
- A front is when two air masses of different temperatures meet. When cold and warm air masses meet, you can usually expect turbulent, stormy weather.
- A cold front happens when cold air and bad weather moves into an area. On a weather map, a blue line with teeth show which direction the cold front is moving. A warm front occurs when warm air moves into an area. A red line with half circles indicates a warm front.
POWER POINT:
WORKSHEETS TO PRACTICE
Weather Map. Predict the Weather worksheet.
Science Worksheet_ reading a weather map
Science Worksheet_ reading a weather maplower
VIDEOS TO REVIEW:
